5 Reasons to Implement Data Dashboards in Your Business
Get the latest updates about our blog posts.
Subscribe so you don’t miss out!
Data is one of the most important assets of a modern-day business. Especially when applying practices like Lean Analytics and Growth Hacking, decisions regarding business strategies and approaches are mostly data-driven. But data doesn’t mean much when it’s not organized and structured. You have to know exactly what you’re looking for and where to look for it in order to analyze and use the information for growth. Luckily, there are data dashboards, which are centralized platforms that show you the metrics that matter most. These so-called “business intelligence dashboards” are designed and developed to provide a safe environment that’s accessible for anyone who wants to get an insight into their business’ performance. Besides their accessibility, data dashboards bring along a lot more benefits.
Digital Data Dashboards
Digital data dashboards, or business intelligence dashboards, are information management tools that are designed to process, analyze and display specific data values and Key Performance Indicators (KPIs) that represent the status and health of your business. A Key Performance Indicator is a specific measurable value that is used to track the performance of a company, product, or initiative over time. Setting KPIs can help businesses measure to what extent they are successful in achieving key business objectives.
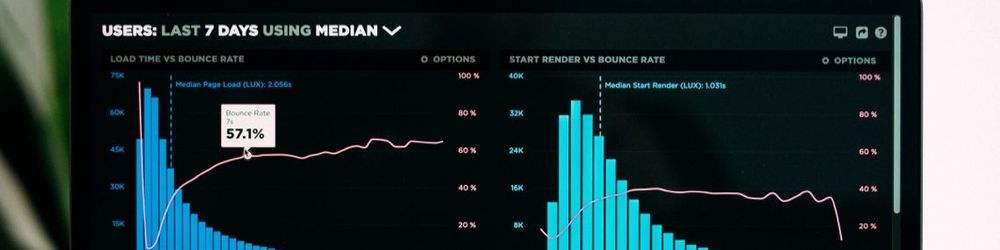
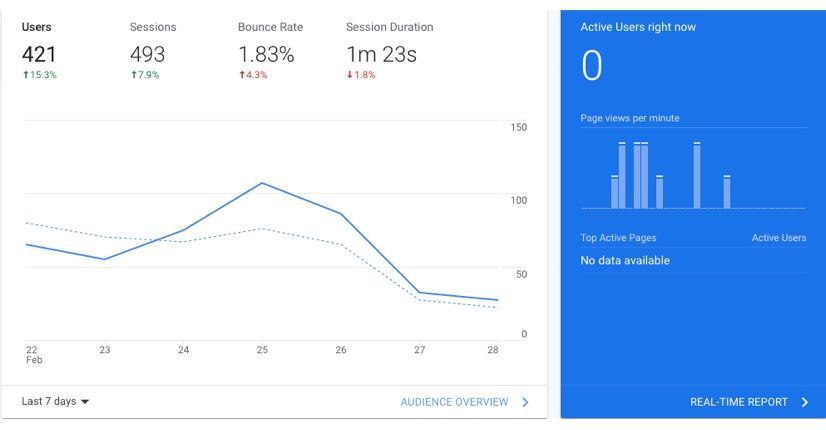
Most data dashboards are customizable to the needs and requirements of your business or department, and can greatly contribute to the optimization of your business processes. Data dashboards can be connected to your files, databases, services, and APIs in the backend, but the front-end often solely consists of data visualizations in the form of tables, charts, and graphs. Google Analytics is probably one of the most popular digital data dashboards, and offers a long list of services you can use to track specific metrics or set and work towards customized goals.
Generally, data dashboards are divided into three categories: operational dashboards, strategic dashboards, and analytical dashboards. An operational dashboard is usually used as a reporting tool to monitor business processes that tend to frequently change. This type of data dashboard is designed to be used multiple times a day, closely tracking the progress towards a specific target or objective. A strategic dashboard is a tool that is used to monitor the status of things such as KPIs, which are looked at a bit less frequently than operational dashboards. A strategic dashboard helps executives stay on top of their KPIs within their organization. Finally, analytical dashboards, such as Google Analytics or Google Search Console, are used to analyze large amounts of data to help businesses investigate certain trends, discover insights, and predict potential outcomes. Analytical dashboards are often designed by data scientists, and can therefore be a bit more challenging to get familiar with than operational or strategic dashboards.
No matter the type of dashboard, it’s clear that digital data dashboards offer a lot of functionalities and insights for businesses to track their progress towards growth. Here’s a list of 5 reasons to consider implementing a digital data dashboard in your organization.
1. Monitor multiple metrics at once
Probably the most efficient factor of digital data dashboards is their capacity to showcase multiple metrics and KPIs at the same time, in one centralized environment. Users don’t have to access multiple different tools and services in order to track their progress, and most dashboards are designed in such a way that it doesn’t take long for users to get familiar with the interface.
2. Cloud-accessible
Most modern data dashboards are accessible through the Cloud. This means that the data is accessible for multiple users at the same time, no matter their location or the device they’re using. This doesn’t only allow users to work remotely, it also greatly stimulates collaboration within organizations, as multiple employees can access and use the data at the same time.
3. Easy to read
Data dashboards are designed in such a way that users are directly faced with the most important data when accessing the digital environment. This saves a lot of time by avoiding the process of browsing through multiple menus and folders to obtain the information they need. Now more and more businesses are implementing these data dashboards in their organization, creators of these dashboards know how important it is to provide an easy-to-understand service.
4. Valuable reporting
Data dashboards often provide the option to set goals and track the progress towards these goals. During the process of working towards these goals, the dashboard can provide useful information and feedback to optimize and adapt certain strategies in order to achieve the set objectives. Digital dashboards usually offer the functionality of sending out notifications to keep users up-to-date with the metrics even when they’re not using the platform.
5. Accelerates growth
When you’re looking for a way to optimize the internal processes of your business and become more efficient and agile, implementing data analytics can be a great way to accelerate this internal process optimization. By tracking the metrics that matter most and making data-driven decisions, like in the practice of Lean Analytics, you and your team can continuously adapt your strategies to stimulate improved metrics and, eventually, sustainable growth. Not only are you constantly optimizing your strategies, but closely monitoring data also makes sure your team is engaged with the growth process.
Need a hand?
At Lizard Global, we’ve successfully developed multiple centralized data dashboards for our clients, which you can check out on our projects page and digital portfolio. As official partners of Salesforce, one of our core services includes the integration of CRM software, which allows our clients to optimize their customer relationship management by automating internal processes and providing a centralized digital environment, customized to the unique needs and requirements of their business. Are you looking for a partner to help you with the integration of your CRM software, or the design and development of your very own business intelligence dashboard? Give us a call, and we gladly lend you a hand!