Lean Analytics: How To Track & Analyze Key Metric Effectively?
Get the latest updates about our blog posts.
Subscribe so you don’t miss out!
Key takeaways:
- Focus on the OMTM: Track the One Metric That Matters at each stage of your business to stay aligned with your goals and avoid distractions.
- Set Clear Goals: Define measurable objectives and benchmarks to evaluate your progress and success.
- Use Analytics Tools: Leverage tools like Google Analytics and Mixpanel to collect, visualize, and track key metrics effectively.
- Iterate Based on Data: Regularly analyze your metrics to identify patterns and make data-driven decisions that improve your product or strategy.
- Adapt to Growth: As your business evolves, continuously refine your metrics to reflect new priorities and challenges.
One of the most powerful tools to drive growth, optimize processes, and ultimately, succeed is data. Lean Analytics is a methodology that takes a data-driven approach to identify, track, and analyze the most important metrics at any given stage of your business. Instead of being overwhelmed by endless data points, it encourages you to focus on the One Metric That Matters (OMTM), using it to guide decisions and improve products iteratively.
In this blog, we’ll dive deep into how to effectively track and analyze key metrics using Lean Analytics, helping you ensure that your business is on the right path for growth and sustainability.
1. Identify the Most Important Metric (OMTM)
Every business, regardless of the type of product it offers, starts from the same point: identifying the most important metric. However, the specifics depend on several factors like the product type, the industry, and the stage of growth your business is in.
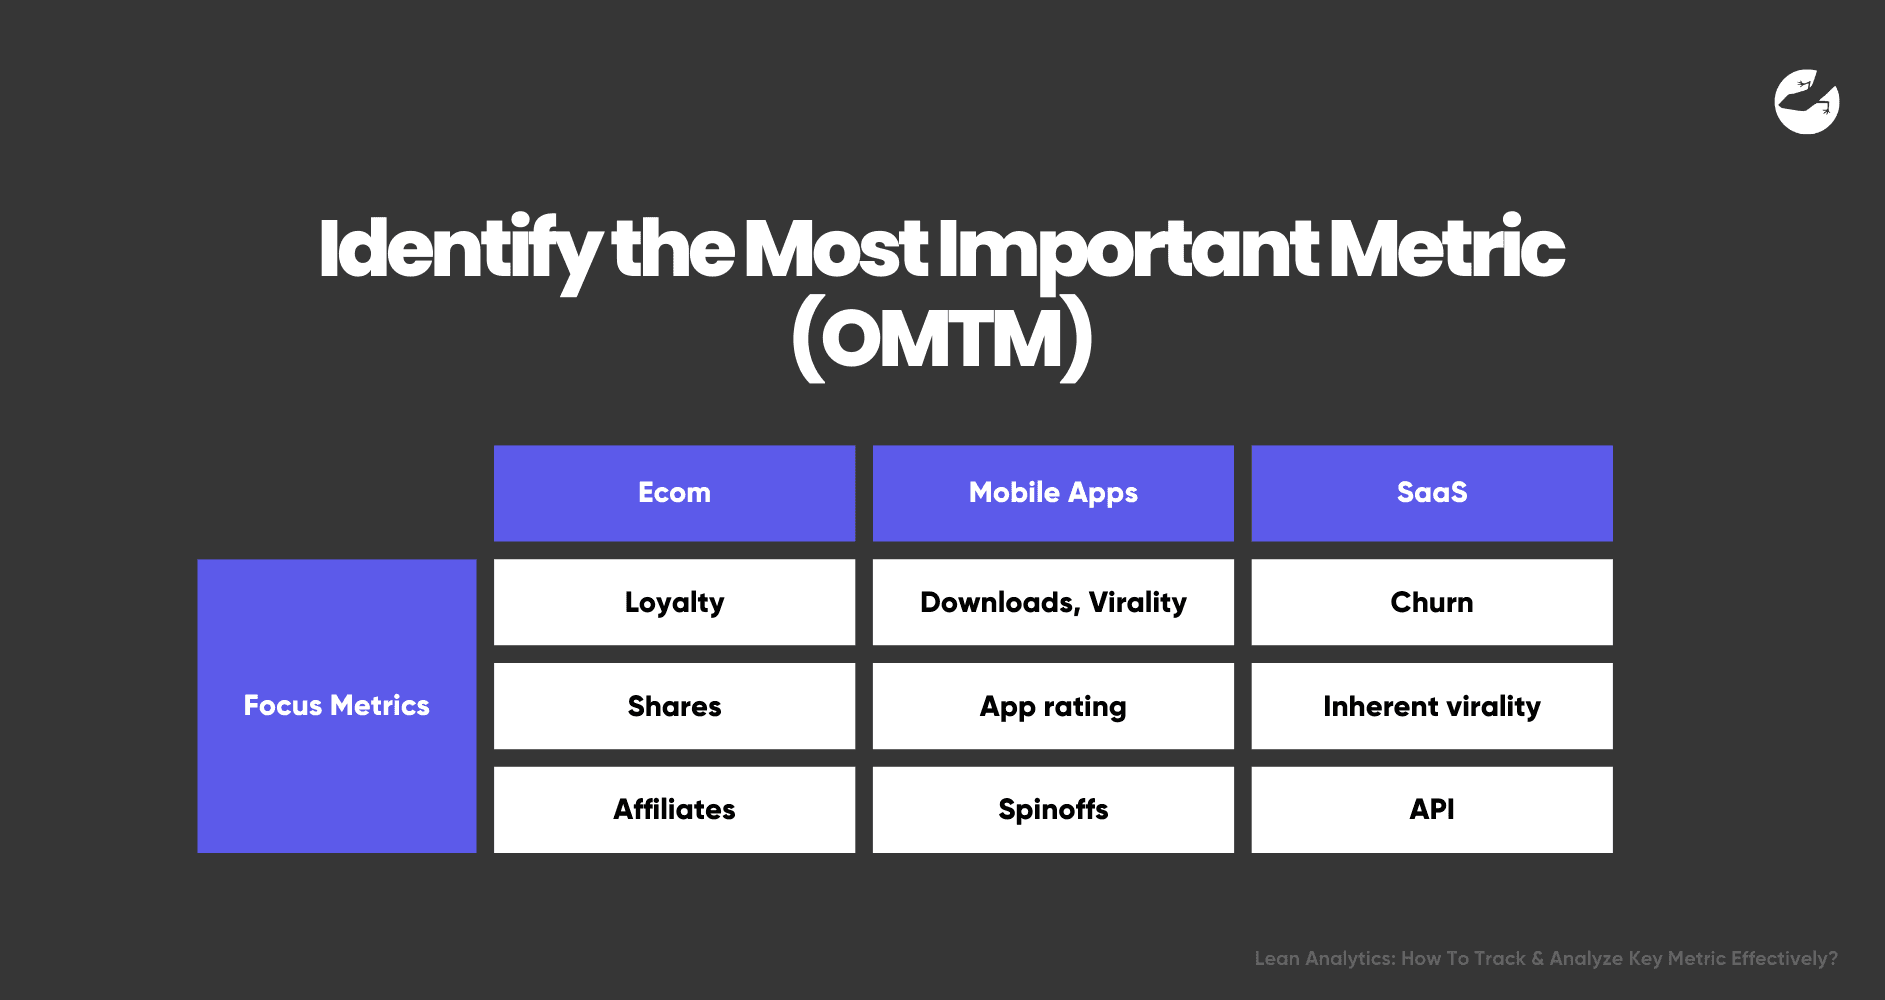
Here’s a breakdown based on common types of products and their stages:
- E-commerce Platforms: In this case, metrics such as conversion rate and average order value could be the main focus.
- Mobile Apps: These are often focused on metrics like user acquisition and engagement early on. For example, you may track downloads and active users in the beginning.
- User-Generated Content Platforms/SaaS: These may focus on content uploads, sharing frequency, or user engagement metrics like daily active users (DAU).
Focusing on the OMTM (One Metric That Matters) ensures that you're directing attention to the most critical area that can drive growth at any given time.
For example, in the early stages, a mobile app might focus solely on downloads, while a more mature app may shift focus to retention rates or monetization.
2. Set Clear Goals and Benchmarks
Once you've identified the OMTM, the next step is to set clear goals and benchmarks. Without defined objectives, it’s impossible to evaluate whether your business is on track. Here's how to effectively approach this:
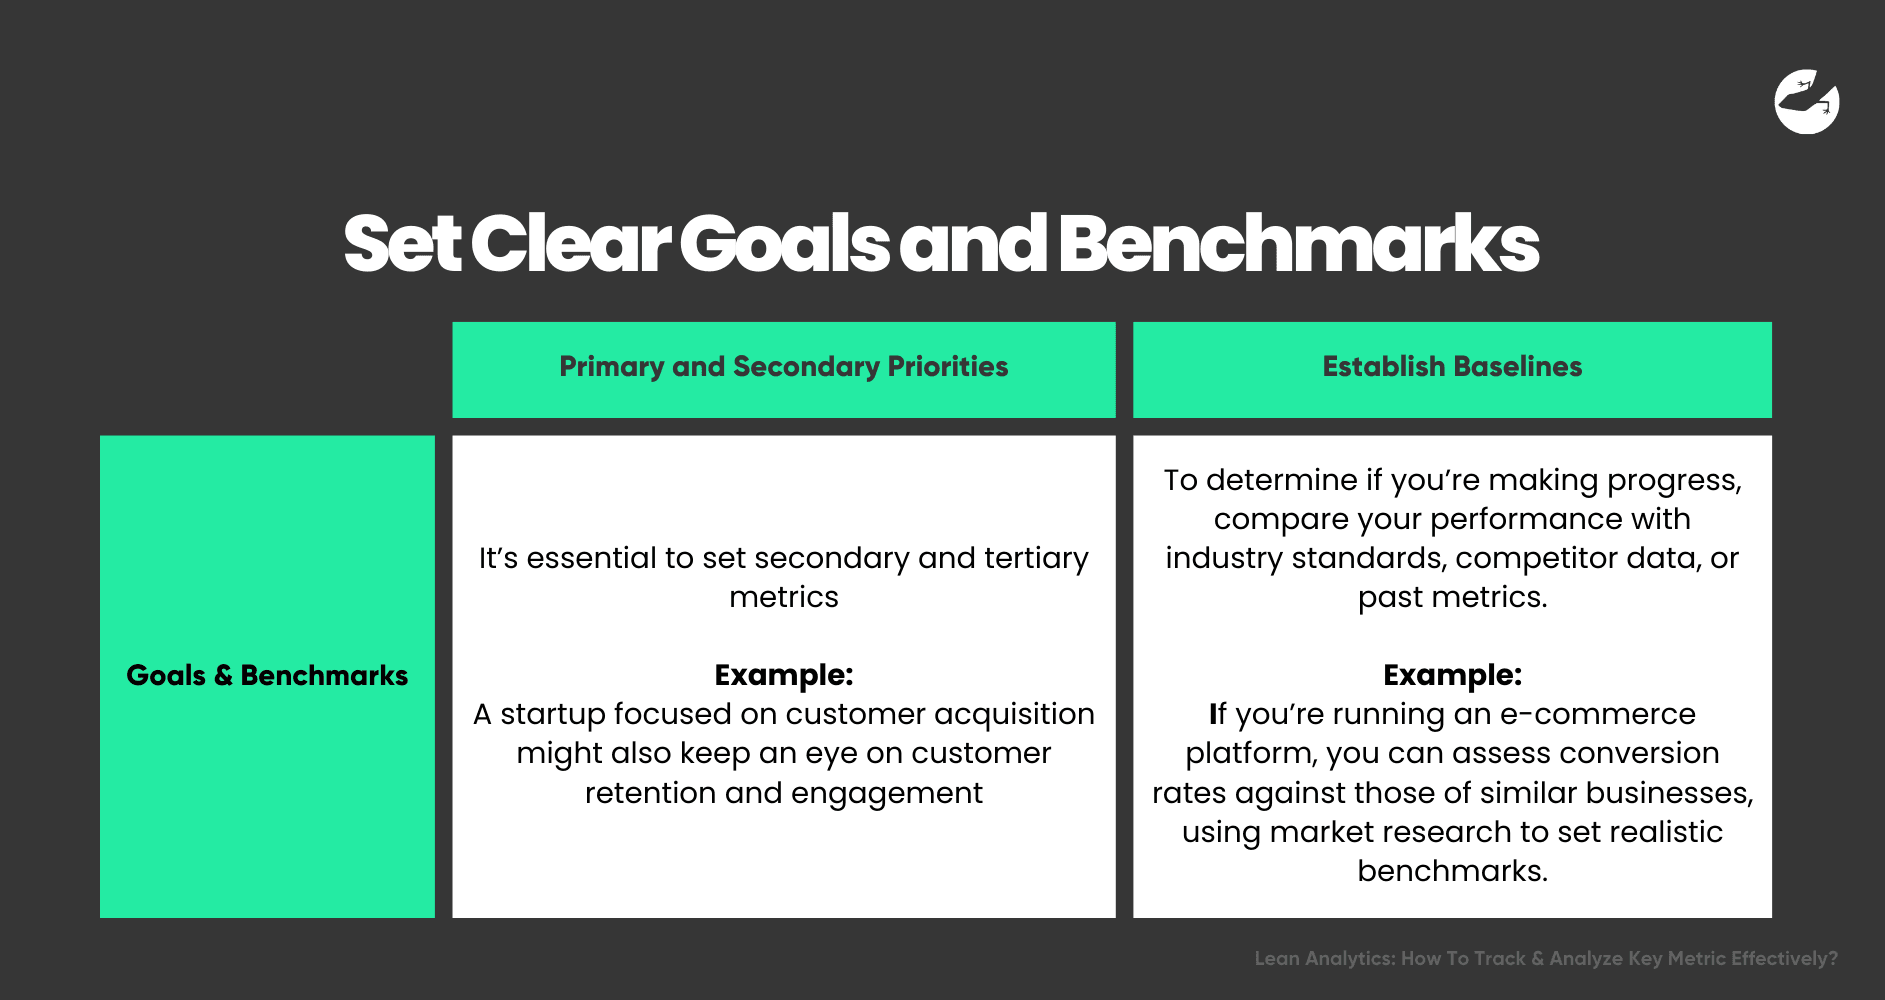
- Primary and Secondary Priorities: While the OMTM is your main focus, it’s essential to set secondary and tertiary metrics as well. For example, a startup focused on customer acquisition might also keep an eye on customer retention and engagement.
- Establish Baselines: To determine if you’re making progress, compare your performance with industry standards, competitor data, or past metrics. Baselines give you a solid starting point.
For example, if you’re running an eCommerce platform, you can assess conversion rates against those of similar businesses, using market research to set realistic benchmarks.
Regularly measuring your progress against these benchmarks helps identify where improvements are needed or if new goals need to be set.
3. Implement Lean Analytics Using Tools
The next step is to leverage analytics tools to gather and interpret your data. Numerous tools exist to help businesses track key metrics, and your choice should align with your business type and goals. Some popular tools include:
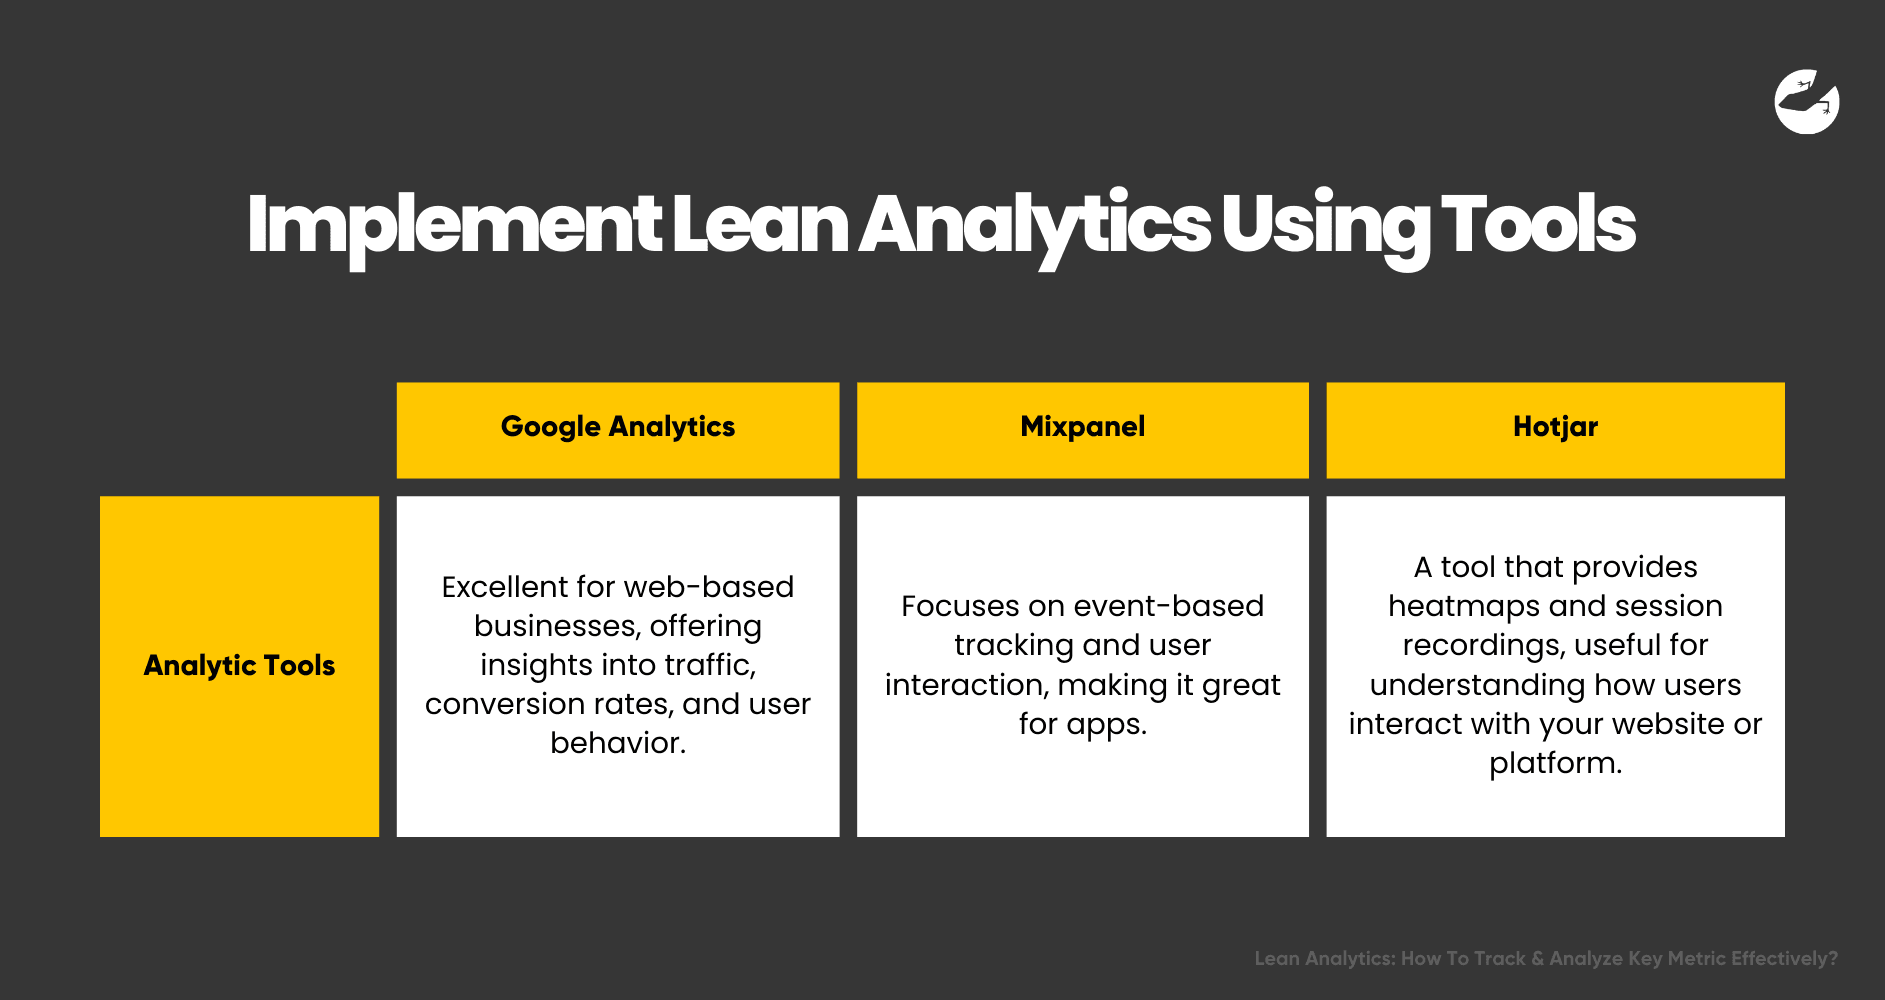
- Google Analytics: Excellent for web-based businesses, offering insights into traffic, conversion rates, and user behavior.
- Mixpanel: Focuses on event-based tracking and user interaction, making it great for apps.
- Hotjar: A tool that provides heatmaps and session recordings, useful for understanding how users interact with your website or platform.
These tools help you collect and visualize data, providing valuable insights into your most important metrics.
For example, if your OMTM is related to customer engagement, tools like Mixpanel can track user interaction on your app or website, showing you which features are used most frequently.
Want to find out how much it costs to build your dream app or web app?
4. Analyze & Iterate
Once you’ve gathered the data, it’s time to analyze and use it to improve your product or strategy. This is where Lean Analytics truly shines—validated learning.
You’ll often find that some metrics improve while others remain stagnant. The goal here is to continuously look for patterns and insights that reveal what’s working and what isn’t.
For example:
- If your churn rate (the percentage of users who stop using your product) remains high, you may need to improve your onboarding process or enhance the user experience.
- If engagement metrics are strong but conversion rates are low, you might need to refine your call-to-action or simplify your checkout process.
Remember that Lean Analytics is cyclical. After each iteration, you analyze the results, implement changes, and track the metrics again.
5. Data-Driven Development
Lean Analytics is not a one-time process but a continuous cycle. As your business evolves, so will your key metrics.
For example, a startup may initially focus on customer acquisition but shift to customer retention as it grows. This is why it’s essential to reassess your metrics regularly and adapt your strategies based on the current stage of your business.
By continuously monitoring and adjusting based on the data, you ensure that your product remains aligned with user needs and market demands, helping your business to grow sustainably.

Benefits of Lean Analytics
By implementing Lean Analytics, businesses can experience several key benefits that contribute to long-term success:
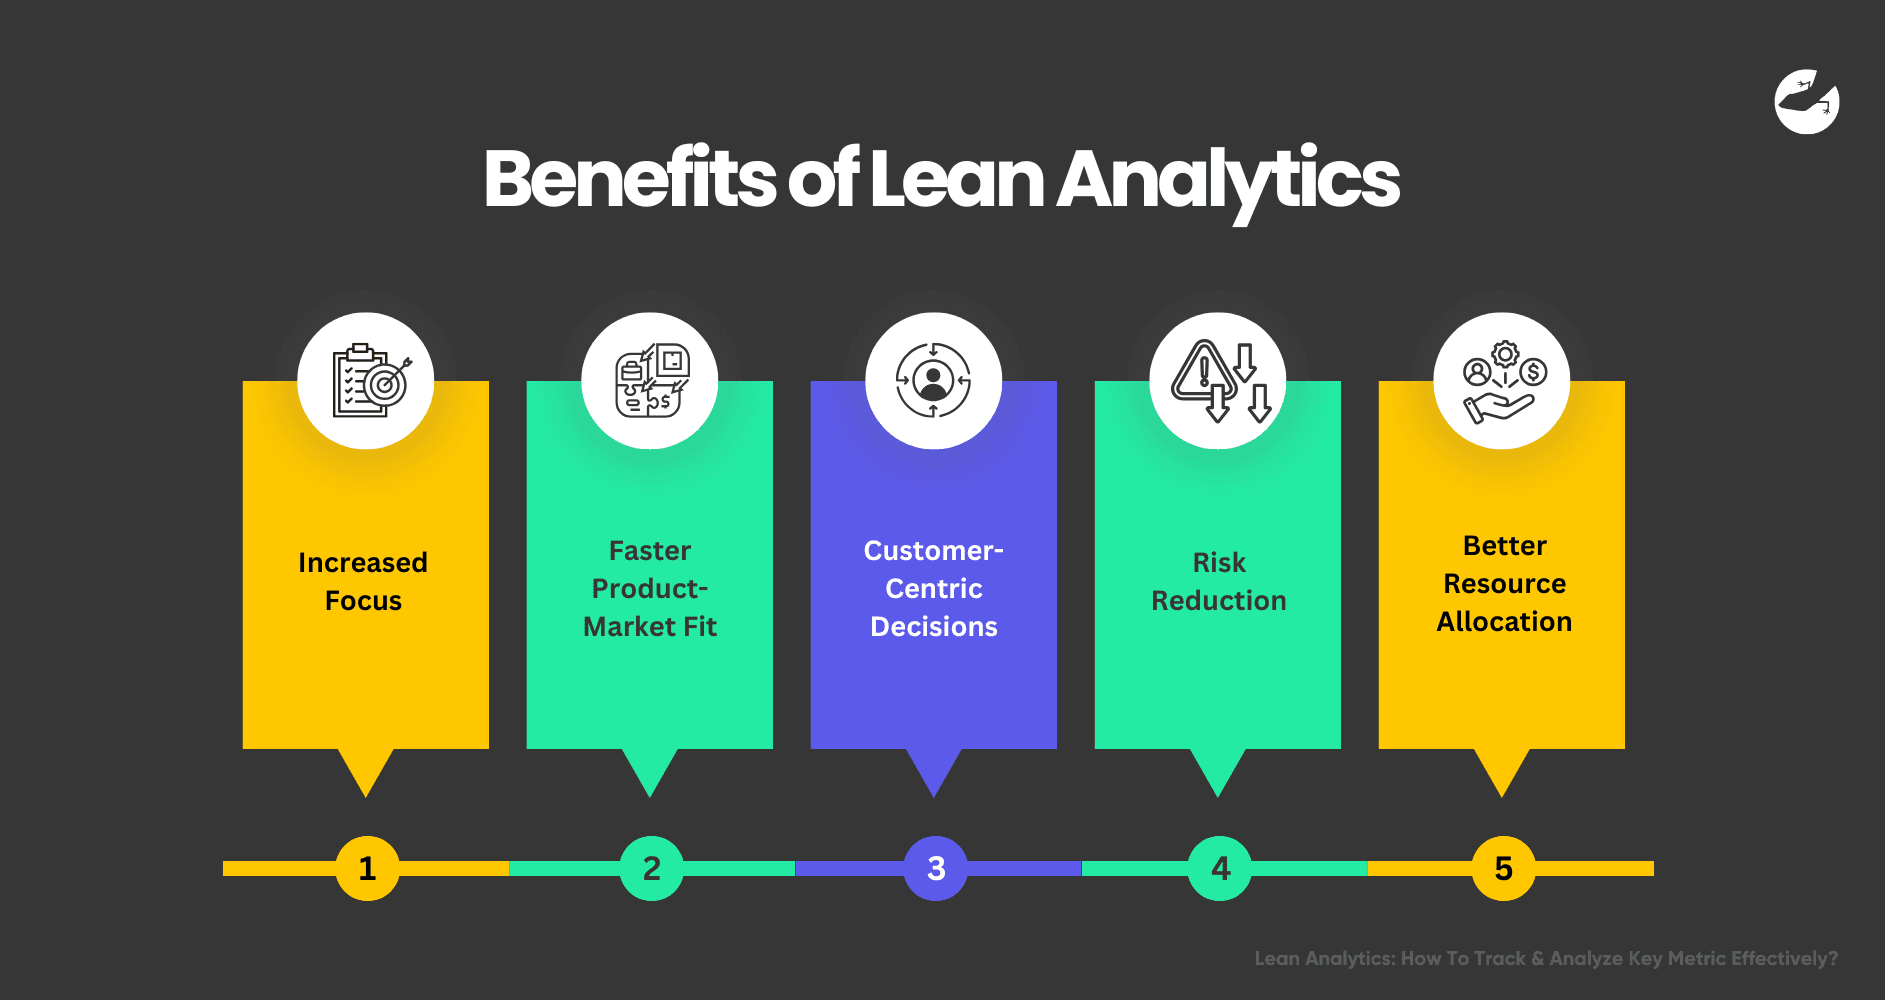
- Increased Focus: Narrowing down your attention to a few key metrics eliminates distractions, allowing your team to focus on what's most critical for growth.
- Faster Product-Market Fit: With real-time feedback from your metrics, you can iterate more quickly, validating (or invalidating) hypotheses and improving your product until it meets market demands.
- Customer-Centric Decisions: Tracking metrics that directly impact customer experience ensures that you make data-driven decisions that better serve your users, resulting in higher satisfaction and loyalty.
- Risk Reduction: Lean Analytics emphasizes validated learning, reducing the risk of failure by ensuring you only invest in strategies that are proven to work through data.
- Better Resource Allocation: With clear insights into what's working and what's not, you can allocate resources more effectively, focusing your time, budget, and energy on areas that will generate the highest returns.
Key Metrics to Track Depending on Your Business Stage
The type of metrics you focus on will vary depending on the stage of your business. Below are some key metrics to consider based on your growth phase:
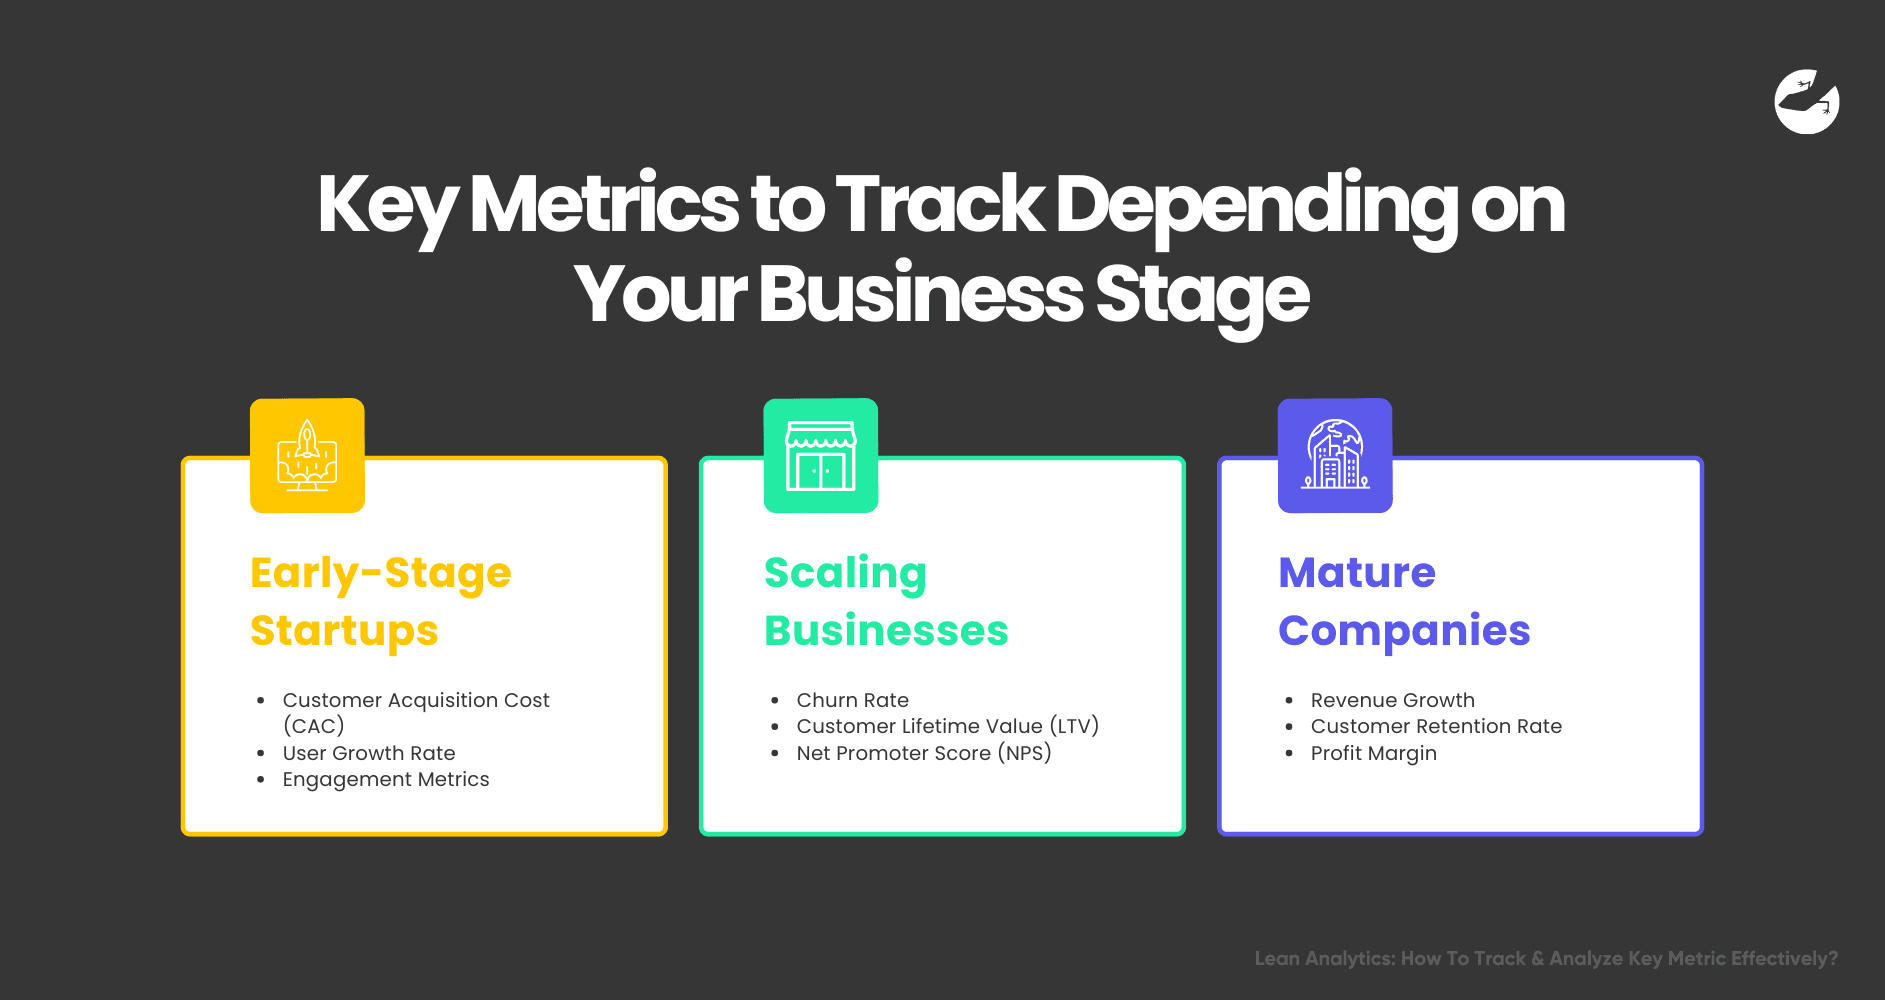
For Early-Stage Startups:
- Customer Acquisition Cost (CAC): The cost of acquiring a new customer, critical for understanding how efficiently you’re growing your user base.
- User Growth Rate: The speed at which your user base is expanding.
- Engagement Metrics: Metrics like daily active users (DAU) or monthly active users (MAU) help track user interaction with your product.
For Scaling Businesses:
- Churn Rate: The percentage of users who stop using your product. A high churn rate can indicate problems with user satisfaction or product-market fit.
- Customer Lifetime Value (LTV): The total amount of revenue a customer generates over the lifetime of their relationship with your business.
- Net Promoter Score (NPS): Measures how likely customers are to recommend your product, which is a good indicator of customer satisfaction.
For Mature Companies:
- Revenue Growth: Tracks the increase in total revenue over time.
- Customer Retention Rate: Measures how many customers return after their initial purchase or interaction.
- Profit Margin: The percentage of revenue that exceeds the cost of production.
How Lizard Global Can Help Your Business
Ultimately, tracking and analyzing key metrics is not just about collecting data—it's about using that data to continuously improve. At Lizard Global, we put into practice what we preach. With our clients' success as our number 1 priority, we heavily rely on lean analytics to make the informed decisions through the data we obtain, making your business more agile and responsive to changing market conditions and customer needs.
